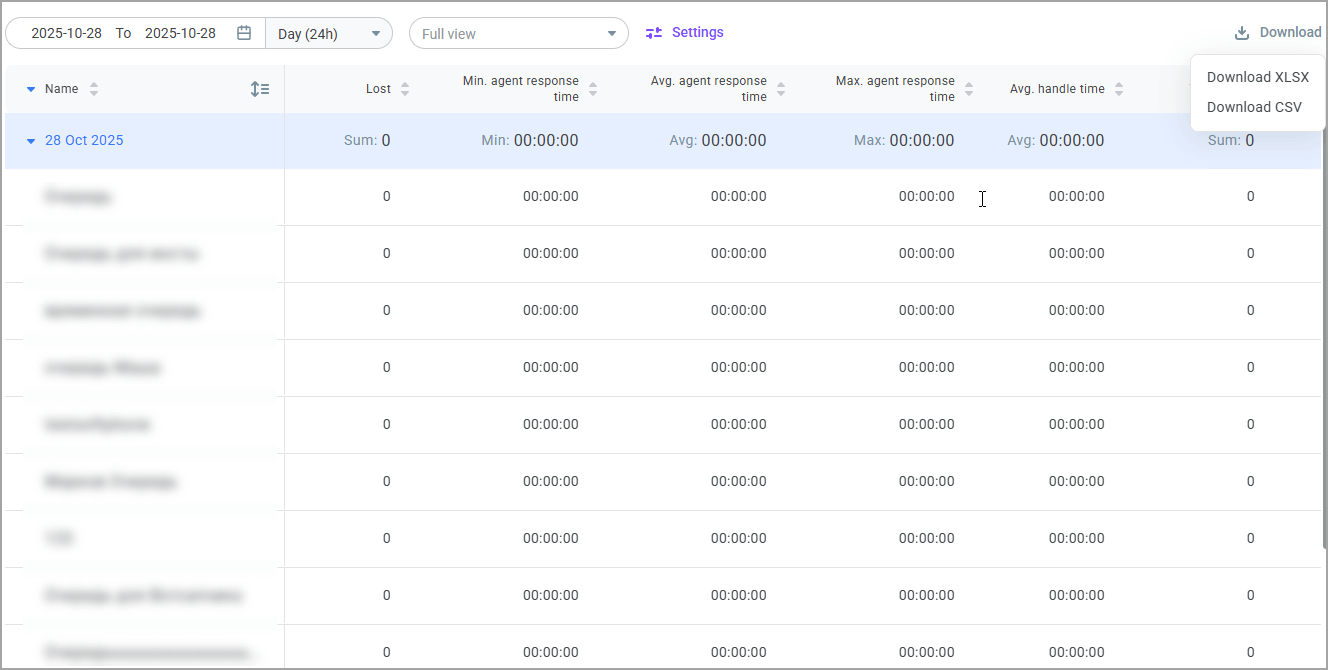
Historical metrics: conversations
- On the left sidebar, select Reporting > Reports.
- Select Queues.
- On the Conversations tab, set the report date range.
- Specify the data display interval: per Hour, Day, Week, Month, or All time.
- Review the report.
A queue conversations report includes the following information:
Received – The total number of conversations that entered the queue during the selected period.
Handled – The total number of conversations distributed from the queue and processed during the selected period. A conversation is considered processed if it was manually closed by a user or if the Maximum customer silence time was reached.
Transferred – The number of conversations transferred to another queue/agent during the selected period. The number of transfers within a single conversation is not counted in this metric. The system counts only transfers to a queue from which or within which a transfer was made.
Transferred (%) – The ratio of conversations transferred to another queue/agent to the total number of conversations that were processed or are currently being processed for the selected period.
Lost – The total number of conversations distributed from the queue and lost during the selected period. A conversation is considered lost if one of the following limits was reached: Maximum waiting time, Maximum queue size, or Maximum agent silence time.
Service level (%) – The ratio of all conversations in which the first response from an agent was given within the established SL period and fell within the designated period, to the total number of conversations in which the first response from an agent fell within the designated period. The resulting figure is multiplied by 100%.
Min. first reply time – The minimum time from when a conversation was assigned to an agent until the first response from that agent during the selected period. The metric is calculated for periods when the following events occurred: a conversation was assigned to an agent or a conersation was in process (first response from an agent received).
Avg. first reply time – The average time from when a conversation was assigned to an agent until the first response from that agent during the selected period. The metric is calculated for periods when the following events occurred: a conersation was assigned to an agent or a conersation was in process (first response from an agent received).
Max. first reply time – The maximum time from when a conversation was assigned to an agent until the first response from that agent during the selected period. The metric is calculated for periods when the following events occurred: a conersation was assigned to an agent or a conersationwas in process (first response from an agent received).
Avg. handle time – The average time it takes agents to process conversations during the selected period. The metric is calculated as the ratio of the conversations' total processing time to the total number of conversations processed. This metric is calculated for periods when the following events occurred: a conersation was distributed to an agent, a conersation was closed by a user, or the Maximum customer silence time elapsed.

- Click the Download button to download the report as an .xls or .csv file.
- Click the Settings icon to select which queues you want to monitor and which columns you want to display. You can save your filters as a custom view and share it with other users.
